The past winter was globally the warmest on record. At the same time it set a new cold record in the subpolar North Atlantic – and it was very cold in the eastern parts of North America. Are these things related?
Two weeks ago NOAA published the following map of temperature anomalies for the past December-January-February (i.e. the Northern Hemisphere winter). One week ago, we published a paper in Nature Climate Change (which had been in the works for a few years) arguing that the cold in the subpolar North Atlantic is indicative of an AMOC slowdown (as discussed in my last post). Immediately our readers started to ask (as we indeed had been asking ourselves): does the cold winter in eastern North America (culminating in the Inhofe snowball incident) have anything to do with what is going on in the Atlantic?
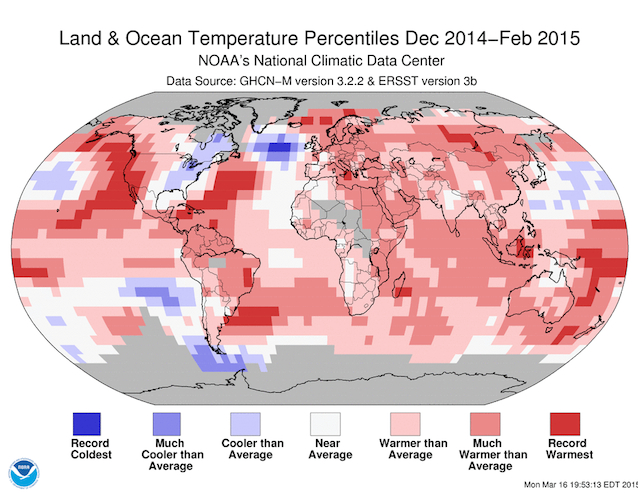 Fig. 1 Temperature anomaly map for the past december-january-february, from NOAA.
Here is a hypothesis for how they may indeed be linked. This is somewhat speculative – I have not investigated this with any special data analysis, I am just connecting the dots of some articles in the published literature, hoping this post might stimulate further investigation. The proposed mechanism has three simple steps, as follows.
1. The AMOC slows down – see my previous post.
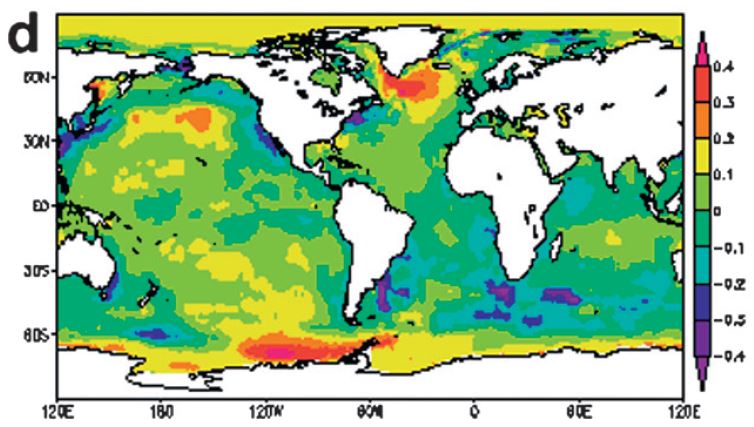
2. The slowdown not only leads to a cold patch out in the Atlantic subpolar gyre, but also to warm sea surface temperature anomalies along the east coast of North America. This dipole response was found in the EOF analysis of observed sea surface temperatures by Dima and Lohmann (2011) (Fig.2). An EOF analysis is a standard statistical tool to decompose changes in space and time into a set of characteristic fixed spatial patterns, each of which follows a particular time evolution. That makes sense when a particular physical mechanism of change (such as an AMOC slowdown) has a characteristic spatial pattern. The pattern shown in Fig. 2 is the one identified by Dima and Lohman with the gradual AMOC decline over the 20th Century. (Note you have to reverse colours – as shown in the graph it corresponds to an AMOC increase, because this pattern is then multiplied with a negative time evolution).
Fig. 2 Temperature pattern EOF2 in the HadISST data set, as analysed by Dima and Lohmann and identified with a gradual AMOC decline. Note that in this (and the following) graph the sign is reversed; an AMOC weakening comes with a cold patch south of Greenland and warming along the North American east coast.
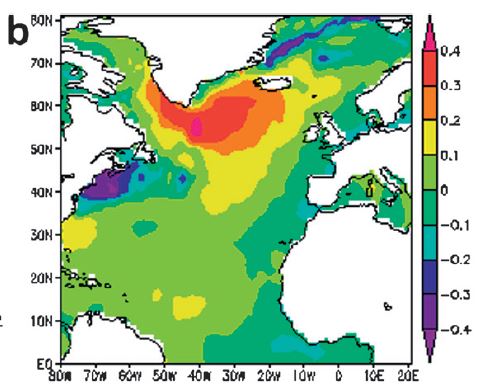
Dima and Lohmann also show a second pattern (Fig. 3) associated with the sudden AMOC decline in the 1970s which we also see in the AMOC index in our paper.
Fig. 3 Temperature pattern derived from a correlation analysis and identified by Dima and Lohmann with a rapid 1970s AMOC weakening.
In either case the anomaly in the subpolar North Atlantic is associated with an opposite anomaly along the North American east coast.
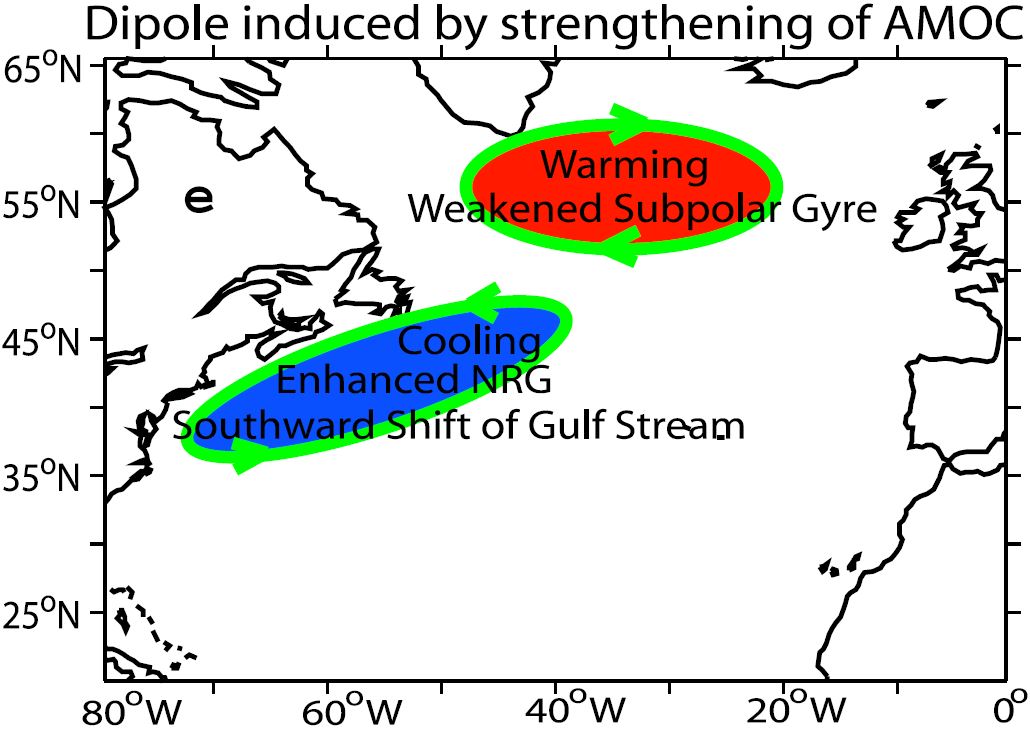
This dipole response to an AMOC slowdown is also found in models, as shown by Zhang (2008) – in her paper she presented the schematic shown in Fig. 4. Note you also need to reverse the colors in the diagram of Zhang – she chose to show the effect of an increase, not a slowdown of the AMOC, because she was looking at the increase after 1990 which we also find in our index. Zhang derived this pattern for the subsurface temperatures, so I asked her whether she also found a similar dipole in sea surface temperatures. She responded: “The dipole pattern shown in the subsurface is indeed also expressed in the SST, I use subsurface temperature because it is less noisy than SST.”
Fig. 4 Dipole induced by strengthening the AMOC – for a weakening of the AMOC the reverse response is expected. From Zhang 2008.
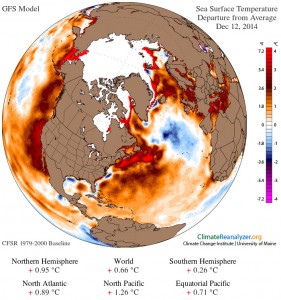
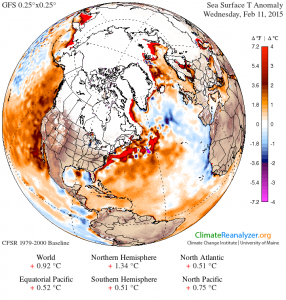
Was this warm anomaly along the American east coast present last winter? Definitely – I happen to have saved two snapshots of SST anomalies on my hard disk, shown below.
Fig. 5 SST anomalies for 12 December and 11 February. Note the cold patch in the subpolar Atlantic and the very warm SSTs along the North American east coast. Source: Climate Reanalyzer.
3. Warm SST along the American east coast creates a cold anomaly in the eastern parts of North America by radiating groups of Rossby waves. This was shown in a very elegant paper by Kaspi and Schneider (2011). They set out to explain why the eastern parts of the northern continents are in general much colder than the rest of the hemisphere. They took an idealized climate model, with no continents or other distractions (an “aquaplanet”), and simply pumped a heat anomaly into one small ocean region to mimic the effect of the Gulf Stream. Voila: upstream of this heat anomaly they got a big cold anomaly.
They also performed a clever, fun experiment: they increased the rotation rate of their planet and showed that the size of that cold patch increases in proportion. The theory of Rossby wave propagation explains this.
Fig. 6 Temperature anomalies that result from adding an ocean heat anomaly in the triangular region on an aquaplanet. This triangular heating region is to mimic warm sea surface temperatures (which provide a strong heat source to the atmosphere) along the North American coast. Note the cold anomaly that develops upstream. Left panel shows normal, right panel doubled rotation rate of the Earth.
They conclude in their paper:
The anomalous winter cold of eastern continental boundaries can result at least in part from radiation of nearly stationary Rossby wave groups off the regions of large surface heat fluxes over the warm waters in oceanic western boundary currents.
(They say “in part” because there are other factors like topography – but these don’t change over time, so don’t come into play when explaining why the last winter was colder than usual.)
Of course we need to be cautious – theirs is an idealised experiment which isolates and demonstrates this mechanisms in principle, but does not prove how strong it is in the real world. Certainly, changes in heating from the Gulf Stream will not be the only thing that influences winter weather along the Atlantic seaboard of North America, so we can’t expect a one-to-one relation. But I think this connection is worthy of further investigation.
By the way, this 3-step explanation of the cold of the past winter is not an alternative to the “jet stream meander” or “polar vortex” explanations – rather, it may simply help to explain why there was this persistent strong southward inflow of polar air into the eastern parts of North America. It might just have been helped along by the very warm waters along the coast – and those may well be related to the AMOC slowdown.
p.s. Sorry about the jargon in this post, which was a quick follow-up to my better-prepared previous one. Here a glossary:
NOAA – National Oceanic and Atmospheric Administration of the USA – an agency that e.g. publishes climate data
AMOC – Atlantic Meriodional Overturning Circulation (for lay people the Gulf Stream System as mentioned in my previous post)
SST – Sea surface temperature
HadISST – a particular sea surface temperature data product from the British Met Office
EOF – Empirical Orthogonal Function – you don’t need to understand how this works, just a statistical method to derive patterns of change
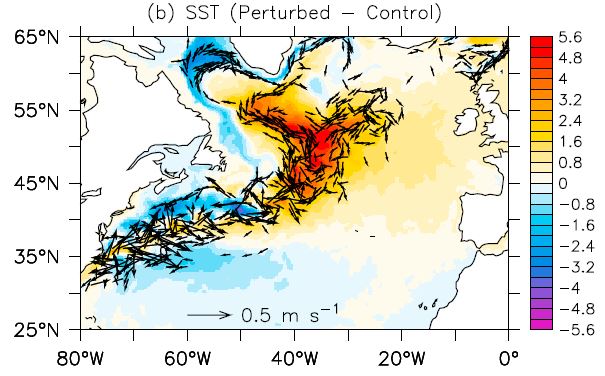
Update 1 April: I just read another related paper which I thought would be worth sharing here. Zhang et al. (Journal of Climate 2011) ran a high-resolution climate model with eddy-permitting ocean – the main point here is that the narrow overflows from the Nordic Seas into the Atlantic can be represented in a much better way at such a high resolution. They perturbed the AMOC by altering the overflow so that it increased, which then had the effect of strengthening the entire AMOC. The change in sea surface temperature looks like this:
Note they get a warming due to the stronger AMOC just in the area where we find a cooling in the data (which we interpret as indicator of a weakened AMOC). And they get a cooling along the North American coast north of Hatteras. The arrows show the change in currents and reveal the reason for that cooling: the northern recirculation gyre, located to the north of the Gulf Stream, increases in strength and brings colder waters from the north down along the US/Canadian coast (as sketched in Fig. 4). Thus this connection described above (point 2 in my argument) is also supported by this high-resolution climate model. This experiment is quite neat in that there is no change to the surface forcing; it is pure isolated effect of the AMOC, triggered by a change way below the surface in the deep overflow.
Weblink: Ocean Changes Linked to 2010 Hurricanes, Bitter Winters
References
- S. Rahmstorf, J.E. Box, G. Feulner, M.E. Mann, A. Robinson, S. Rutherford, and E.J. Schaffernicht, "Exceptional twentieth-century slowdown in Atlantic Ocean overturning circulation", Nature Climate Change, vol. 5, pp. 475-480, 2015. http://dx.doi.org/10.1038/nclimate2554
- M. Dima, and G. Lohmann, "Evidence for Two Distinct Modes of Large-Scale Ocean Circulation Changes over the Last Century", Journal of Climate, vol. 23, pp. 5-16, 2010. http://dx.doi.org/10.1175/2009JCLI2867.1
- R. Zhang, "Coherent surface‐subsurface fingerprint of the Atlantic meridional overturning circulation", Geophysical Research Letters, vol. 35, 2008. http://dx.doi.org/10.1029/2008GL035463
- Y. Kaspi, and T. Schneider, "Winter cold of eastern continental boundaries induced by warm ocean waters", Nature, vol. 471, pp. 621-624, 2011. http://dx.doi.org/10.1038/nature09924

Except that the AMOC is not slowing down..
http://www.nasa.gov/topics/earth/features/atlantic20100325.html
Why do you keep ignoring real data?
[Response: I’m not sure about your final sentence… you find an old press release and link it to a completely unwarranted accusation. The data used by Willis first of all are no more or less real than our data (neither are direct current measurements – both draw their conclusions about the overturning circulation from parameters measured at the surface, in our case temperature, in his case sea surface height). More importantly, our conclusions completely agree. His data covers the period from 1993-2008, for which we find a small increase in overturning (see the graph in my last Realclimate article) and so does Willis. This increase is also found in the analysis of Zhang as mentioned above.
And of course we do not “ignore” Willis’s data, but write in our paper: “The twentieth century shows a gradual decline in the AMOC index, followed by a sharp drop starting around 1970 with a partial recovery after 1990 (discussed further below). This recovery is consistent with the finding of an AMOC increase since 1993 based on floats and satellite altimeter data19.” Reference 19 is to the Willis data.
I would suggest that before coming here and accusing scientists of something, you should check the basic facts first. -stefan]
One very modest step that can be taken on this post and all other scientific writings in order to help educate interested readers: always first give the full name of something and its acronym in parentheses following, prior to using the acronym alone, e.g.: “Atlantic Meridional Overturning Circulation (AMOC)”. This is something that new reporters are trained to do–because all readers are assumed to be newbies–and it would be an excellent discipline for scientific communicators as well.
[Response: Thanks, good point! I’ve added a glossary at the bottom.]
By coincidence (?) the UK is ‘downstream’ of the North Atlantic cold spot, yet we are still seeing above average temperatures (note though the cold Winters of 2010-11 probably linked to a THC slowdown), which on the surface seems to repeat the pattern you suggest.
Carl don’t need no stinking facts.
And you’ve just perfectly demonstrated the problem the climatology scientists have… Your jargon is unintelligible, nor could most of them do any better with the biological jargon in which my research work was soaked,and the general public can’t read either of them. Too much prior understanding is assumed. I, for instance, having read the first part three times (I’m almost ready to start diagramming sentences), still do not understand why you reversed the signs in the warming cooling gyres (at least I know what a gyre is). Granted I hold only a Master of Science in Ecology and Environmental Science (from USU’s School of Wildlife Biology), but I am nonetheless a scientist, and I am made to feel utterly ignorant.
Now, if I become frustrated enough, I can dig this stuff apart and figure out the details, or I can say, “Well, I trust the methodology used by competent scientists,” which is my more likely response. And I have valid reason for that. Unfortunately, the general public, and that includes the lawyers who make up the vast majority of our State and federal Representatives and Senators, does not. They just get lost in this stuff.
[Response: Agreed – this post was written too quickly as a follow-up and assumed prior knowledge of the key terms from my previous post. Btw. – you don’t need to understand why in some cases the temperature pattern is plotted for an increase and in some cases for a decrease in the AMOC, as long as you get the point that the colours in some plots are just the other way round although they show the same thing. -stefan]
This more recent research on the AMOC suggests it is still declining but not as the climate models suggest.
http://www.ocean-sci.net/10/29/2014/os-10-29-2014.pdf
Well doc, based on this diagnosis, what is the prognosis?
#1 and response: Ah, but to a denialist ‘real data’ is data that kinda, sorta, somehow supports the argument that he happens to be making at the moment–at least, if you look at it squinch-eyed in the exactly the right light.
I’m a bit confused – could the current east Pacific SST anomalies also be playing a contributing role – or is that included in the above analysis?
http://www.nhc.noaa.gov/aboutsst.shtml
The role of Pacific SSTs could be something like this: the large body of warm water along the North American west coast must be dumping more moisture into the atmosphere; this moisture is carried by the jet stream northwards (hence not ending up falling out as snow over the Sierra Nevada, Cascade Range, etc.) over Canada where it encounters cold dry subpolar air sweeping down from the Arctic; hence what you have in this configuration is record snowfalls and cold snaps across the eastern United States.
This is interesting in that some scientists are now saying that a reduced average equator-to-pole temperature gradient will mean less extreme weather, not more – but that argument seems to ignore seasonality – i.e. while average temperature gradients may decrease, the seasonal transitions would become more abrupt due to masses of warm wet tropical air mixing with breakouts of cold dry arctic air.
Here’s the press release for that claim, out of Zurich and Caltech –
http://www.sciencedaily.com/releases/2015/03/150327132207.htm
“The study’s point of departure was that higher latitudes are indeed warming faster than lower ones, which means that the temperature difference between the equator and the poles is decreasing. Imagine for a moment that this temperature difference no longer exists. This would mean that air masses would have the same temperature, regardless of whether they flow from the south or north.”
This report seems a bit iffy, due to the seasonal temperature changes brought on by the tilt of Earth’s axis.
You should perhaps check with Norwegian oceanographers..
http://www.nrk.no/verden/–golfstraumen-har-ikkje-endra-seg-1.12287209
[Response: But that article first wrongly claims that the Willis data contradict our results (as you did), and then secondly discusses thermohaline flows to the north of the cold patch we discuss (namely the exchange with the Nordic Seas), which according to our Fig. 2 does not correlate at all with that cold patch south of Greenland and about which we have accordingly made no claims whatsoever. No inconsistency with our paper there. -stefan]
Interesting essay. As I look at Fig. 1, I see a pattern that seems reminiscent of the winter of 2013-2014: colder than average along the eastern part of the U.S., and warm and dry on the west coast, with above normal SST for eastern Pacific and western Atlantic. I don’t recall seeing a figure like Fig. 1 for last winter (Dec., 2013 – Feb., 2014). Would be interesting to compare the two if available. You mention last winter, and refer to Fig. 5, but the two images in Fig. 5 are labeled Dec. 12, 2014 and Feb. 11, 2015, which I interpret as being for the winter we just had (i.e., “this” winter — we still have snow on the ground here in the Boston area), and in fact seems to be within the same time frame as your Fig. 1. Is that what you meant by “last winter”? But perhaps I’m reading it wrong (wouldn’t be the first time).
In any case, I’m wondering if this pattern is the new normal. If so, should we in the Boston area expect another interesting winter next year? And what is the future of California agriculture if this is the new normal? Or, as SecularAnimist asked (comment 7): “what is the prognosis?”
Is the West coast warm anomaly the right number (actually fractional) of Rossby wavelength away from the dipole that it serves to strengthen/weaken the effect of global circulation? If this hypothesis works out to be true, what does it say about the extreme dryness/heat we’ve been having on the west coast?
Chuck Larlham: I sympathize and I disagree. It’s a pleasure and a great lesson to find someone who isn’t afraid to think out-loud in public. This kind of leadership is rare and valuable.
If the person is a substantial thinker, then it’s all the more so.
The contributors and guest-post authors on this site can be found on Facebook, Twitter, and any number of science, culture, and news sites, as well as in the books, textbooks, and research they have authored.
Citizen scientist (his term) Peter Sinclair is a good example of another kind. He’s the public too, and he got it.
Durou: 30 Mar 2015 at 11:25 AM
Thanks for the document. This research is reference #28 on the new study by Rahmstorf et al., which is the topic of the previous post by Stefan.
http://www.nature.com/nclimate/journal/vaop/ncurrent/full/nclimate2554.html
Context from UK National Oceanography Centre of the Natural Environment Research Council on the reference you cite:
http://noc.ac.uk/news/ten-years-ocean-monitoring-uncovers-secrets-changing-uk-winters
Durou: 30 Mar 2015 at 11:25 AM
Thanks for the document. It (Smeed et al. 2014) is the #28 reference on the new study by Rahmstorf et al., which is the topic of the previous post.
http://www.nature.com/nclimate/journal/vaop/ncurrent/full/nclimate2554.html
Context from UK National Oceanography Centre of the Natural Environment Research Council on the reference you cite:
http://noc.ac.uk/news/ten-years-ocean-monitoring-uncovers-secrets-changing-uk-winters
When the AMOC runs at it’s “normal” speed, the heat off the US east coast would be carried to the cold spot to cancel it out?
Following up my comment in the previous thread– for which this is a perfect example:
I am not asking for a prognosis, as SecularAnimist and robert are, but rather, what would you *need* to give a confident, relatively definitive prognosis for this regional effect?
How, or when, would the characterization of a “new normal” for Eastern USA become part of the science, if there were to be such a characterization?
Is there any new methodology in the works that can get us beyond just waiting for the time series to fill in?
Racetrack Playa- @ #9, I’m always a bit leery about sweeping claims based on “simple models”. The study you point to uses a model described thusly:
“We test the validity of the theoretical arguments and changes in the PDF of near-surface potential temperatures more quantitatively in simulations with an idealized GCM, which has a hydrologic cycle, an entirely water-covered surface, and a simple representation of ocean heat transport in low latitudes”
A Water World with no sea-ice and no land with orographic effects and different albedos or seasonality? What good is that? Of course, the report goes much further, comparing their results with those from 8 models taken from the Coupled Model Intercomparison Project (CMIP5) RCP8.5 simulation experiments. There’s quite a bit to digest from their effort, but the basic assumption is that the CMIP5 results are a valid projection for the future, so it’s just another brick in the wall, IMHO.
The pattern is indeed a strong hint for a weakening of the AMOC as observed since 2004 and very strong during 2014 ( see SSTspg). When one compares the correlation of the SSTspg http://www.directupload.net/file/d/3943/dn63d7xe_jpg.htm ( via CE) with GISShttp://data.giss.nasa.gov/tmp/gistemp/NMAPS/tmp_GHCN_GISS_ERSST_1200km_Anom1203_2015_2015_2000_2007/nmaps.gif as the deviation from the early years of the century…there could be a clear connection of the pattern to the impact of a (strong) weakening of the AMOC.
I am surprised that your line of inquiry did not address the nearly zero ocean heat accumulation in the northern hemisphere during the ARGO buoy period, with ALL OHC accumulation in the south. This is a stark declaration of the dimming of northern hemisphere sun by anthro aerosols. This effect works to temporarily increase the rate of the AMOC, masking the effects of recent glacial melt as well as helps establish the West Pacific Ridiculously Resilient Ridge blocking pattern which funneled the aerosol stream north into the Yukon and then into a standing wave pattern through the Eastern U.S. and up into the North Atlantic.
Slowing or speeding of sub-polar gyre makes very little difference, a single cycle takes anything up to 20 years. What matters is the feedback driven oscillation between the SST and westerly winds further north (two down-welling areas); surprisingly (but for a good reason) the Nordic Seas summer’s down-welling is the dominant influence on the SST multi-decadal oscillations.
The “cold spot” is fresher water, and equally cold but saltier water would sink, allowing the surface warmer salty water to move into that area?
(I’m asking, I’m not at all sure of the time sequence over say a decade here, with changes in temperature and salinity of parcels of water)
I found:
Nature 457, 711-714 (5 February 2009) | doi:10.1038/nature07717; Received 17 March 2008; Accepted 9 December 2008
Holocene oscillations in temperature and salinity of the surface subpolar North Atlantic
David J. R. Thornalley1, Harry Elderfield1 & I. Nick McCave
I also have to disagree with Chuck Larlham (and, by extension, with Stefan himself, I guess). Stefan referenced his previous post at the top of the current post, so anyone paying attention, and, a fotiori, any scientist, should have read that post before complaining about jargon in the current post. Is the sum of the two posts still a problem? Well, it isn’t for me, and I’m not a scientist at all. I suppose it’s possible that there’s something undefined that an educated reader could not be expected to understand, but I don’t see it. As for the sign reversals in the temperature patterns, well, that’s pretty basic stuff: I think even my 10-year-old would get it, but I haven’t done the experiment yet, so I’m not certain.
Hank Roberts, #20 – Here’s a link to another interesting paper on changes to the subpolar gyre (STG) at the end of the Eemian, associated with the return of Ice Age conditions:
Oceanographic dynamics and the end of the last interglacial in the subpolar North Atlantic
They conclude with this comment: “This allowed the warm and salty waters from the STG to penetrate to higher latitudes in the northeast Atlantic and into the Nordic seas, which in turn contributed to the intensification of northern AMOC during glacial inception, as proposed by previous model and data inferences. Paradoxically, despite the northward heat transport of this inflow, the intensified deep overturning at this time may have contributed to the regional and thus global glaciation by providing a moisture source for incipient glaciers…”
Something to think about.
I feel that too often the wheel is re-invented every year. Looking at the SST anomaly pattern off the US East Coast here, it strongly reminds me on my thesis from about 20 years back in an uncoupled atmospheric GCM study, where I compared one decade of a positive SST anomaly to a 100 years climatological reference run of a T42 model with 95% t-test. The study is in German but the graphics are self-explanatory to the expert. I got a large literature compilation which you may use as further reference to previous studies (kindly quote me).
http://www.scribd.com/doc/231457635/Der-Einfluss-Nordatlantischer-Meeresoberflachentemperaturanomalien-SST-Anomalien-auf-die-globale-Zirkulation-der-Atmosphare-The-Impact-of-North-At
The impact is purely generated by that pattern of localized positive SST anomaly off the US East Coast. The only force in the Control Run of the GCM is the underlying monthly mean global SST. The study was fundamental to further as well coupled studies at the time and is more sophisticated than a pure water planet calculation.
A comprehensive overview (ca 2012) is http://centaur.reading.ac.uk/27753/1/bams-d-11-00151%252E1.pdf – PAST, PRESENT, AND FUTURE CHANGES IN THE ATLANTIC MERIDIONAL OVERTURNING CIRCULATION, SROKOSZ et al
“Send et al. (2011) conclude that there has been a 20% (~3 Sv) reduction in the AMOC at 16°N.”
” Willis (2010) noted that this[his} approach is limited to latitudes where the main upper-ocean flows are in water depths of 2000 m or greater…” and “41°N is an index of maximum AMOC strength from ocean in situ Argo float measurements in the upper 2,000 m combined with satellite altimeter data. The lower limb is not measured.”
And since part of the flow is not measured, nothing can be inferred about “no trend” in the total AMOC.
More recent observations than the preliminaty stuff Carl found reported by the BBC in 2010 can be found at http://www.ocean-sci.net/10/29/2014/os-10-29-2014.pdf “Observed decline of the Atlantic meridional overturning circulation 2004–2012,” Smeed et al, Ocean Sci., 10, 29–38, 2014: doi:10.5194/os-10-29-2014
“We have shown that there was a slowdown in the AMOC transport between 2004 and 2012 amounting to an average of −0.54 Sv yr−1 (95 % c.i. −0.08 to -0.99 Sv yr−1)at 26N, and that this was primarily due to a strengthening of the southward flow in the upper 1100 m and a reduction of the southward transport of NADW below 3000 m.[Found it! Here’s an observation that shows the downward trend not observed in Willis data.] This trend is an order of magnitude larger than that predicted by climate models associated with global climate change scenarios…” **
Basic physics known since Arrhenius seminal work is that nighttime warming from AGW is greater than that of daytime. This effect in isolation should lead to greater winter(e.g.,long arctic night) losses of maximum Arctic sea ice than summer minima; however, the opposite has been observed. If one downloads the ice extent data from (click on the “Raw Data” link)one can look at not only the minimum, maximum, and annual data, but can use a spreadsheet to plot the annual difference between the max and min. Doing so reveals a positive trend in the amount of sea ice that melts out from max in February-March to min in September, and then refreezes in fall/winter. This increase in the yearly freeze thaw cycle (OLS fit y = 0.047e06km*2/year, R² = 0.387)is because of an increase in fresh water content at the surface from increased runoff/glacial/ice sheet/ice shelf melting, which also, from basic physics, will reduce the “haline” density part of thermohaline circulation into the AMOC.
See An assessment of Arctic Ocean freshwater content changes from the 1990’s to the 2006 − 2008 period,Rabe et.al; DOI: 10.1016/j.dsr.2010.12.002
“In comparison to observations from 1992 − 1999 , LFW content relative to a salinity of 35 PSU in the layer from the surface to the 34 PSU isohaline increased by 8400 ± 2000 km^3 in the Arctic Ocean…”
**to be fair (on a blog? who does that!?), Smeed et al. also say “The magnitude of the observed changes suggests that they are a part of a cyclical change rather than being directly linked to the projected anthropogenic AMOC decrease. A much longer time series would be needed to identify a trend of the magnitude associated with greenhouse warming in model simulations.” On the other hand, the models clearly underestimate the magnitude of Arctic sea ice downward trends and cryosphere melting, both of which are physically coupled to the downward trend in AMOC. The large downward blip of AMOC in 2009 – 2010 and the unprecedented decline in which “the weakness of the flow after 1975 is unique in more than a thousand years, with at least 99 per cent probability” observed by Rahmstorf and Mann, suggest the AMOC might be nearing a tipping point to another regime. Until there is a much longer and more comprehensive time series of AMOC observations, this can’t be ruled out(and don’t forget the precautionary principle).
@ 1 & 10
Carl, I for one, in a site like RealClimate, always appreciate having counter-comments like yours to reflect the absolute highest quality of competent reading, thought, analysis & understanding to be found anywhere in the skeptical community.
It’s not very often in RealClimate that we see such a high level of skeptical expertise.
Thank you.
Shelama, was there a fact among Carl’s claims
that you found support for somewhere besides the “skeptic” blogs? I checked his claimed sources, after seeing the inline response
and didn’t find any that Carl got right.
Which of his claims in particular did you find not wanting?
But Hank, do you see any more competent reading than Carl’s in the skeptical community? Or any higher quality thought, analysis or understanding?
Or is Carl as good as it gets?
Stefan, a pity you did not submit your recent MOC results to the EGU 2015 conference. Yesterday there was a great North Atlantic session but with your research it would be even better. There is still much disagreement on the meaning of AMO, its relation to NAO (if any) and even whether it is an oscillation at all (some call it Atlantic Multidecadal Variability to be on the safe side). At least one person (me) was disappointed by your absence.
Arctic Haze, #31, thanks for pointing to the EGU meeting. Looking at the EGU Conference program, I noticed a couple of interesting presentations:
The halt of deep convection in the Greenland Sea: A natural experiment for the study of their causes and effects and:
Exchange of warming deep waters across Fram Strait
From these abstracts, it would appear that there are some important changes underway in the THC processes within the Arctic Mediterranean, perhaps a shift in the location of sinking from the Greenland Sea further into the Arctic Ocean. As I suggested to Stefan in an e-mail, this might indicate that more water from the Norwegian Current is being avected into the Northeast Passage, related to the sea-ice decline poleward of Siberia. If this is occurring, one might also expect to find some changes to weather patterns as well, perhaps some cooling over Northern Europe as some models have projected or the cooling anomaly Stefan found in the sub-polar gyre. See my previous post HERE for an earlier comment.
Slowing or speeding of sub-polar gyre makes very little difference, a single cycle takes anything up to 20 years. What matters is the feedback driven oscillation between the SST and westerly winds further north (two down-welling areas); surprisingly (but for a good reason) the Nordic Seas summer’s down-welling is the dominant influence on the SST multi-decadal oscillations.