Regional Climate Projections in the IPCC AR4

The climate projections presented in the IPCC AR4 are from the latest set of coordinated GCM simulations, archived at the Program for Climate Model Diagnosis and Intercomparison (PCMDI). This is the most important new information that AR4 contains concerning the future projections. These climate model simulations (the multi-model data set, or just ‘MMD’) are often referred to as the AR4 simulations, but they are now officially being referred to as CMIP3.
One of the most challenging and uncertain aspects of present-day climate research is associated with the prediction of a regional response to a global forcing. Although the science of regional climate projections has progressed significantly since last IPCC report, slight displacement in circulation characteristics, systematic errors in energy/moisture transport, coarse representation of ocean currents/processes, crude parameterisation of sub-grid- and land surface processes, and overly simplified topography used in present-day climate models, make accurate and detailed analysis difficult.
I think that the authors of chapter 11 over-all have done a very thorough job, although there are a few points which I believe could be improved. Chapter 11 of the IPCC AR4 working group I (WGI) divides the world into different continents or types of regions (e.g. ‘Small islands’ and ‘Polar regions’), and then discusses these separately. It provides a nice overview of the key climate characteristics for each region. Each section also provides a short round up of the evaluations of the performance of the climate models, discussing their weaknesses in terms of reproducing regional and local climate characteristics.
Africa.
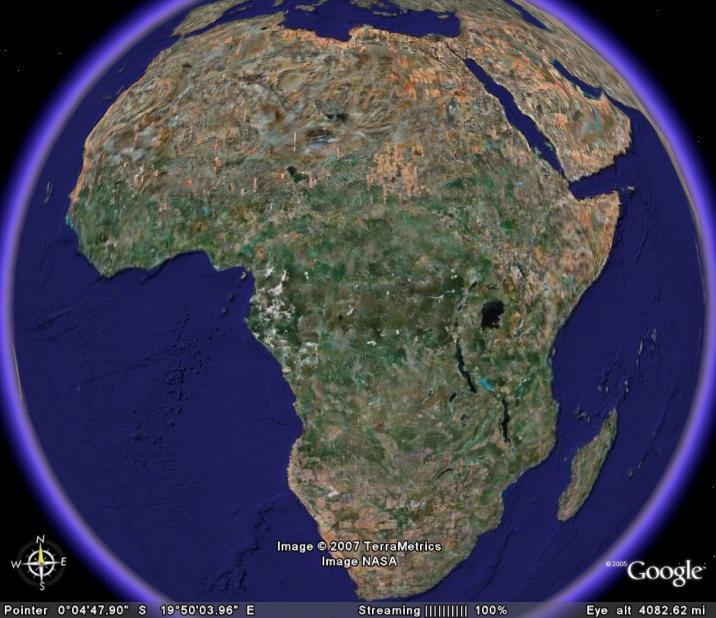
The report asserts that the extent to which regional models can represent the local climate is unclear and that the limitation of empirical downscaling is not fully understood. It is nevertheless believed that land surface feedbacks have a strong effect on the regional climate characteristics.
For the future scenarios, the median value of the MMD GCM simulations (SRES A1b) yields a warming of 3-4C between 1980-1999 and 2080-2099 for the four different seasons (~1.5 times the global mean response). The GCMs project an increase in the precipitation in the tropics (ITCZ)/East Africa and a decrease in north and south (subtropics).
Europe and the Mediterranean.
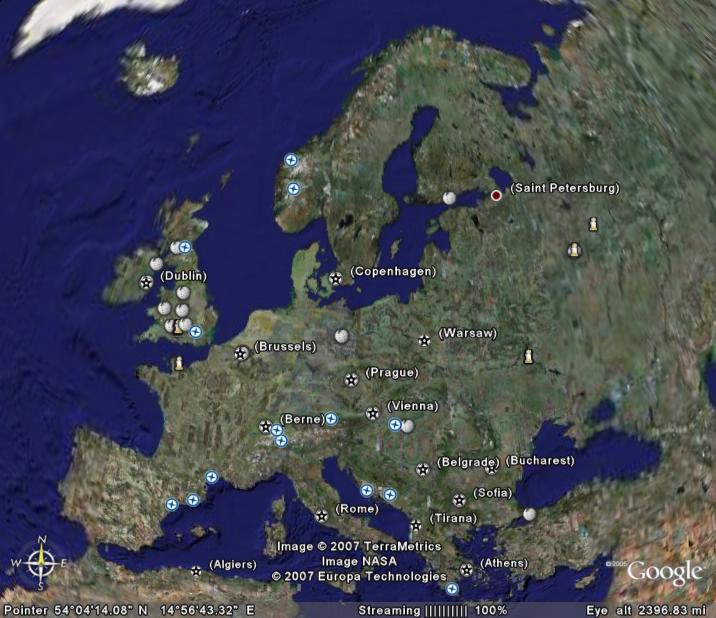
A more detailed picture was drawn on the results from a research project called PRUDENCE, which represents a small number of TAR GCMs. The time was too short for finishing new dynamical downscaling on the MMD.
The PRUDENCE results, however, are more appropriate for exploring uncertainties associated with the regionalisation, rather than providing new scenarios for the future, since the downscaled results was based on a small selection of the GCMs from TAR.
Therefore, I was surprised to see such an extensive representation of the PRUDENCE project in this chapter, compared to other projects such as STARDEX and ENSEMBLES. (One explanation could be that the STARDEX results are used more in WGII, although apparently not cited. The results from ENSEMBLES are not yet published, and besides STARDEX is mentioned twice in section 11.10.)
There are some results for Europe presented in chapter 11 of IPCC AR4 which I find strange: In Figure 11.6 the RCAO/ECHAM4 from the PRUDENCE project yields an increase in precipitation up to 70%(!) along the west coast of mid-Norway. Much of this is probably due to an enhanced on-shore wind due to a systematic lowering of the sea level pressure in the Barents Sea, and an associated orographic forcing of rain.
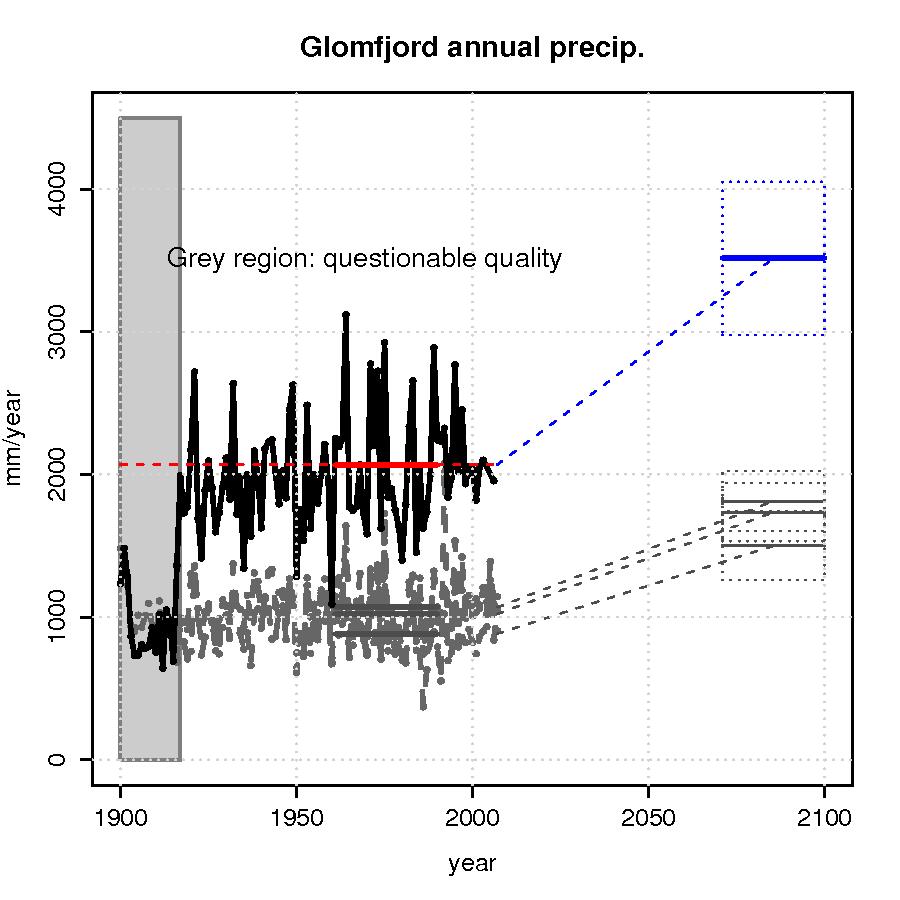
The 1961-90 annual total precipitation measured at the rain gauge at Glomfjord (66.8100N/13.9813E; 39 m.a.s.l.) is 2069 mm/year, and a 70% increase will therefore imply an increase to 3500mm/year (Left figure) which in my opinion is unrealistic . Apart from a sudden jump in the early part of the Glomfjord record, there are no clear and prominent trends in the historical time series (Figure left). The low values in the early part are questionable as the neighbouring station series do not exhibit similar jumps/breaks and is probably a result of a relocation of the rain gauges.
An increase of annual rainfall exceeding 1000mm would imply either that evaporation from the Norwegian Sea area must increase dramatically, or the moisture convergence must increase significantly since the water must come from somewhere. However, the whole region is already a wet region (as indicated by the annual rainfall totals) in the way of the storm tracks.
There are large local variations here (see grey curves in left Figure for nearby stations) and Glomfjord is a locations with high annual rainfall compared to other sites in the same area, but even a 70% increase of the rainfall with annual totals exceeding 1000mm at nearby sites (adjacent valleys etc) is quite substantial.
However, one may ask whether the rainfall at Glomfjord may change at a different rate to that of its surroundings. This question can only be addressed with empirical-statistical downscaling (ESD) at present, as RCMs clearly cannot resolve the spatial scales required.
To be fair, another PRUDENCE scenario presented in the same figure, but based on the HadAM3H model rather than the ECHAM4, suggests an upper limit for precipitation increase over northern Europe of 20% over northern Sweden.
Asia.
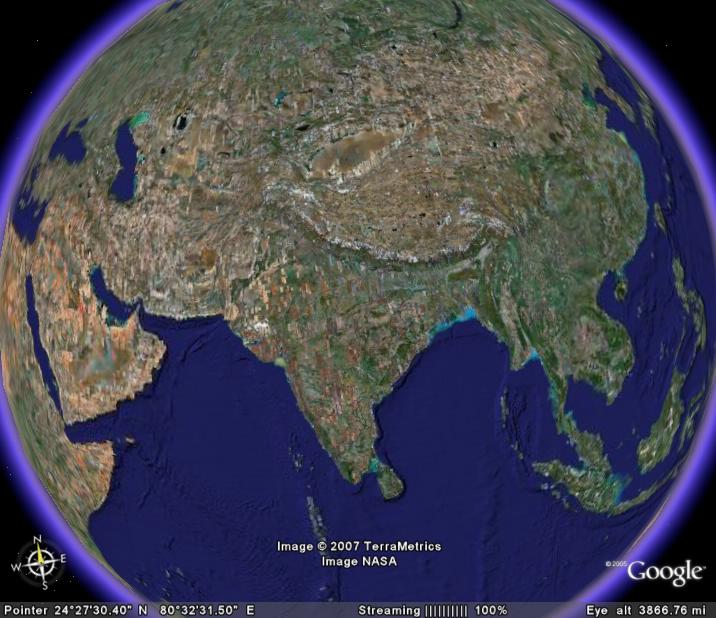
The Asian climate is also influenced by ENSO, but uncertainties in how ENSO will be affected by AGW cascades to the Asian climate.
There are, however, indications that heat waves will become more frequent and more intense. Furthermore, the MMD models suggest a decrease in the December-February precipitation and an increase in the remaining months. The models also project more intense rainfall over large areas in the future.
North America.
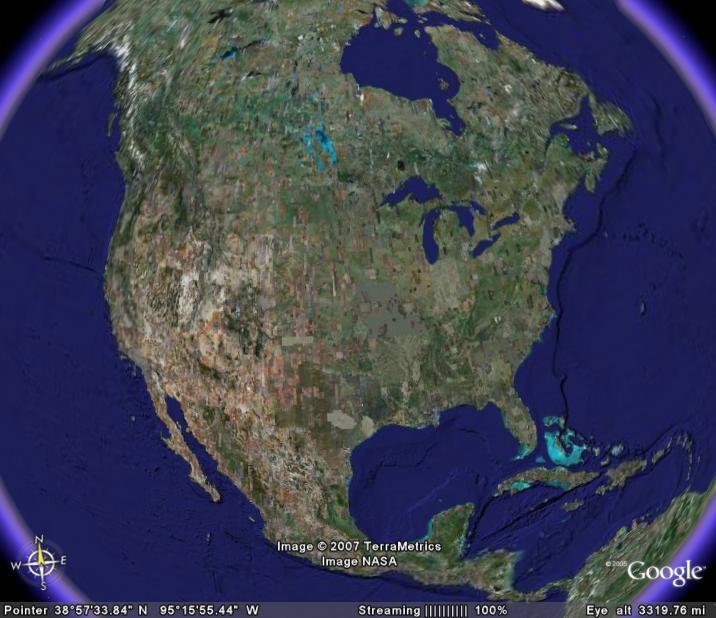
The MMD results project strongest winter-time warming in the north and summer-time warming in the southwest USA. The annual mean precipitation is, according to AR4, likely to increase in the north and decrease in southwest.
A stronger warming over land than over sea may possibly affect the sub-tropical high-pressure system off the west coast, but there are large knowledge gaps associated with this aspect.
The projections are associated with a number of uncertainties concerning dynamical features such as ENSO, the storm track system (the GCMs indicate a pole-ward shift, an increase in the number of strong cyclones and a reduction in the medium strength storms poleward of 70N & Canada), the polar vortex (the GCMs suggest an intensification), the Great Plains low-level jet, the North American Monsoon system, ocean circulation and the future evolution in the snow-extent and sea-ice. Some of these phenomena are not well-represented by the GCMs, as their spatial resolution is too coarse. The same goes for tropical cyclones (hurricanes), for which the frequency, intensity and track-statistics remain uncertain.
A number of RCM-based studies provide further regional details (North American Regional Climate Change Assessment Program). Despite improvements, AR4 also states that RCM simulations are sensitive to the choice of domain, the parameterisation of moist convection processes (representation of clouds and precipitation), and that there are biases in the RCM results when GCM are provided as boundary conditions rather than re-analyses.
Furthermore, most RCM simulations have been made for time slices that are too short to provide a proper statistical sample for studying natural variability. There are no references to ESD for North America in the AR4 chapter except for in the discussion on the projections for the snow.
Latin America.
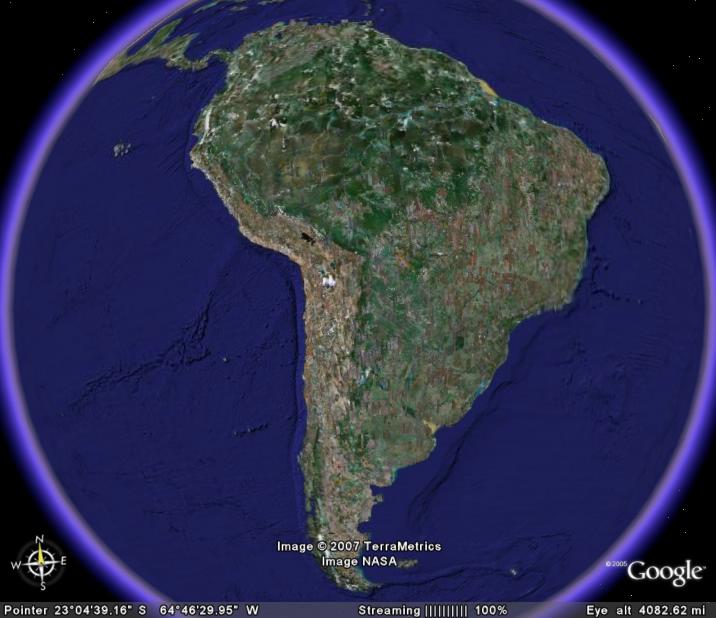
The projections of the seasonal mean rainfall statistics for eg the Amazon forest are highly uncertain. One of the greatest sources of uncertainty is associated with how the character of ENSO may change, and there are large inter-model differences within the MMD as to how ENSO will be affected by AGW. Furthermore, most GCMs have small signal-to-noise ratio over most of Amazonia. Feedbacks from land use and land cover (including carbon cycle and dynamic vegetation) are not well-represented in most of the models.
Tropical cyclones also increase the uncertainty for Central America, and in some regions the tropical storms can contribute a significant fraction to the rainfall statistics. However, there has been little research on climate extremes and projection of these in Latin America.
According to AR4, deficiencies in the MMD models have a serious impact on the representation of local low-latitude climates, and the models tend to simulate ITCZs which are too weak and displaced too far to the south. Hence the rainfall over the Amazon basin tends to be under-estimated in the GCMs, and conversely over-estimated along the Andes and northeastern Brazil.
There are few RCM-simulations for Latin America, and those which have been performed have been constrained by short simulation lengths. The RCM results tend to be degraded when the boundary conditions are taken from GCMs rather than re-analyses. There is, surprisingly, no reference to ESD-based studies from Latin America, despite ESD being much cheaper to carry out and length of time interval being not an issue (I’ll comment on this below).
Australia & New Zealand.
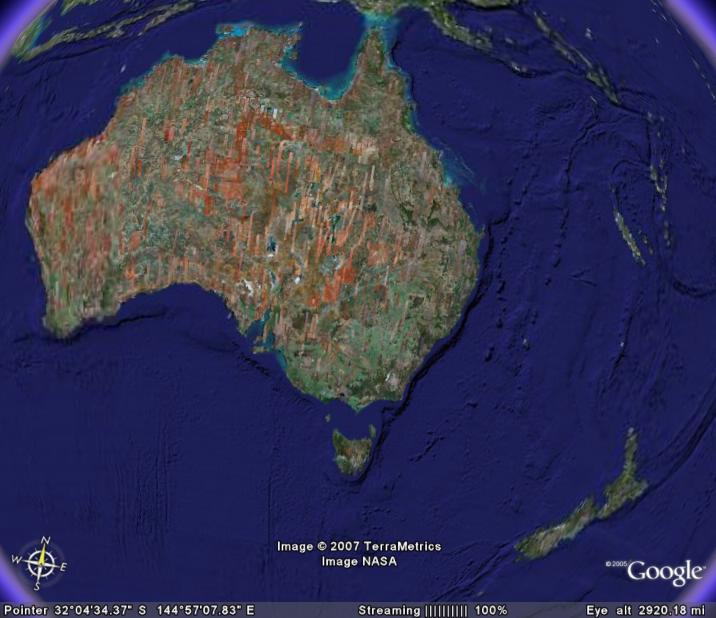
The MMD projections for the monsoon rainfall show large inter-model differences, and the model projections for the future rainfall over northern Australia are therefore considered to be very uncertain.
Little has been done to asses the MMD skill over Australia and New Zealand, although analysis suggest that the MMD models in general have a systematic low-pressure bias near 50S (hence a southward displacement of the mid-latitude westerlies). The simulated seas around Australia has a slight warm bias too, and most models simulate too much rainfall in the north and too little on the east coast of Australia.
The quality of the simulated variability is also reported to be strongly affected by the choice of land-surface model.
The projections of changes is the extreme temperatures for Australia and New Zealand has followed a simple approach where the range of variations has been assumed to be constant while the mean has been adjusted according the the GCMs, thus shifting the entire statistical distribution. The justification for this approach is that the effect on changes in the range of short-term variations has been found to be small compared with changes in the mean.
Analysis for rainfall extremes suggest that the return period for extreme rainfall episodes may halve in late 21st century, even where the average level to some extent is diminishing. AR4 anticipates an increase in the tropical cyclone (TC) intensities, although there is no clear trends in frequency or location.
Furthermore, TCs are influenced by ENSO, for which there are no clear indications for the future behaviour. AR4 also states that there may be up to 10% increases in the wind over northern Australia.
AR4 states that downscaled MMD-based projections are not yet available for New Zealand, but such results are very much in need because of strong effects from the mountains on the local climate. High-resolution regional modeling for Australia is also based on TAR or ‘recent ‘runs with the global CSIRO glimate model. A few ESD studies by Timbal and others suggest good performance at representing climatic means, variability and extremes of station temperature and rainfall.
Polar regions.
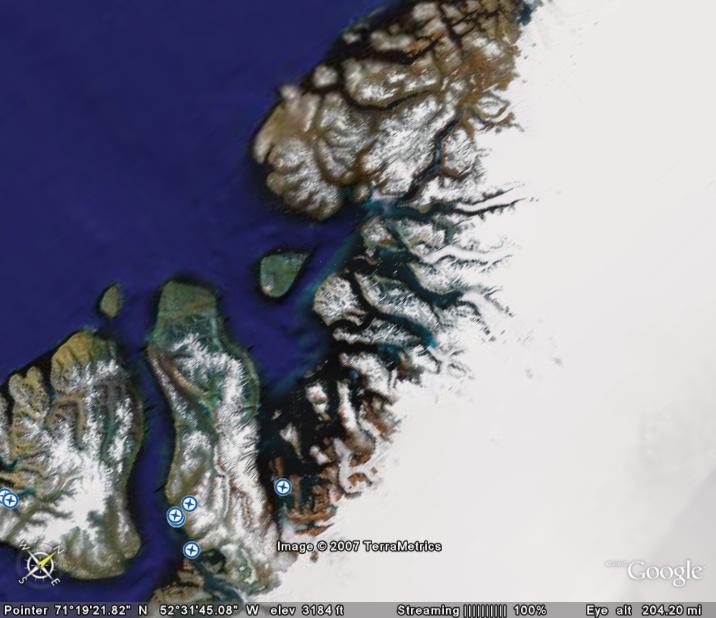
However, the understanding of the polar climate is still incomplete, and large endeavors such as the IPY hope to address issues such as lack of decent observations, clouds, boundary layer processes, ocean currents, and sea ice.
AR4 states that all atmospheric models have incomplete parameterisations of polar cloud microphysics and ice crystal precipitation, however, the general improvement of the GCMs since TAR in terms of resolution, sea-ice modelling and cloud-radiation representation has provided improved simulations (assessed against re-analysis, as observations are sparse).
Part of the discussion about the Polar regions in AR4 relies on the ACIA report (see here , here and here for previous posts) in addition to the MMD results, but there are also some references to RCM studies (none to ESD-based work, although some ESD-analysis is embedded in the ACIA report). There has been done very little work on polar climate extremes and the projected changes to the cryosphere is discussed in AR4 chapter 10.
The models do in general provide a reasonable description of the temperature in the Arctic, with the exception of a 6-8C cold bias in the Barents Sea, due to the over-estimation of the sea-ice extent (the lack of sea-ice in the Barents Sea can be explained by ocean surface currents that are not well represented in GCMs). The MMD models suggest the winter-time NAO/NAM may become increasingly more positive towards the end of the century.
One burning question is whether is the response of the ice sheet will be enhanced calving/ice stream flow/basal melt. More snow will accumulate in Antarctica, as this ‘removes’ water from the oceans that otherwise would contribute to a global sea level rise. The precipitation in Antarctica, and hence snowfall, is projected to increase, thus partly offsetting the sea-level rise.
Small islands.
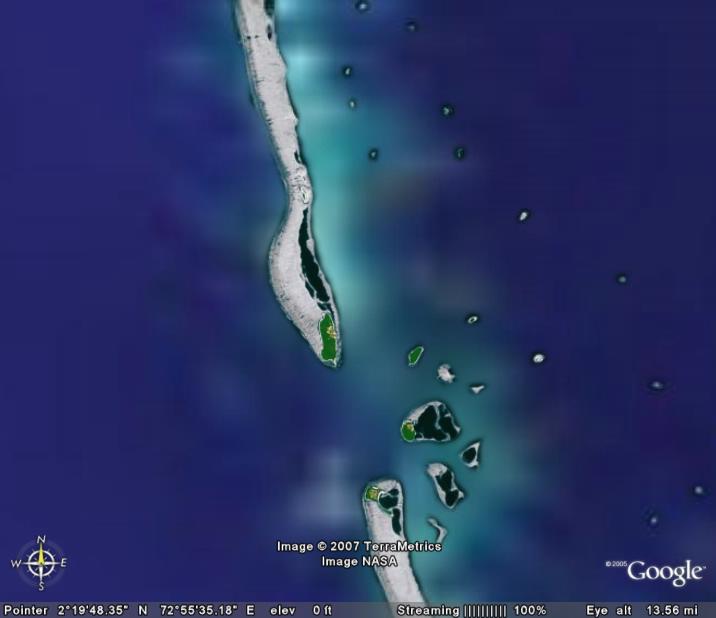
Most GCMs do not have sufficiently high spatial resolution to represent many of the islands, therefore the GCM projections really describe changes over ocean surfaces rather than land. Very little work has been done in downscaling the GCMs for the individual islands. However, there have been some ESD work for the Caribbean islands (AIACC).
Two sentences stating that ‘The time to reach a discernible signal is relatively short (Table 11.1)’ is a bit confusing as the discussion was referring to the 2080-2099 period (southern Pacific). After having conferred with the supplementary material, I think this means that the clearest climate change signal is seen during the first months of the year. Conversely when stating ‘The time to reach a discernible signal’ for the northern Pacific, probably refers to the last months of the year.
Other challenges involve incomplete understanding of some climatic processes, such as the midsummer drought in the Caribbean and the ocean-atmosphere interaction in the Indian Ocean.
Many of the islands are affected by tropical cyclones, for which the GCMs are unable to resolve and the trends are uncertain – or at least controversial.
Empirical-statistical or Dynamical downscaling?
AR4 chapter 11 makes little reference to empirical-statistical downscaling (ESD) work in the main section concerning the future projections, but puts most of the emphasis on RCMs and GCMs. It is only in Assessment of Regional Climate Projection Methods section (11.10) which puts ESD more into focus.
I would have thought that this lack of balance may not be IPCC’s fault, as it may be an unfortunate fact that there are few ESD studies around, but according to AR4 ‘Research on [E]SD has shown an extensive growth in application…’. If it were really the case that ESD studies were scarce, then it would be somewhat surprising, as ESD is quick and cheap (here, here, and here), and could have been applied to the more recent MMD, as opposed to the RCMs forced with the older generation GCMs.
ESD provides diagnostics (R2-statistics, spatial predictor patterns, etc.) which can be used to assess both the skill of the GCMs and the downscaling. I would also have thought that ESD is an interesting climate research tool for countries with limited computer resources, and it would make sense to apply ESD to for climate research and impact studies to meet growing concerns about local impacts of an AGW.
Comparisons between RCMs and ESD tend to show that they have similar skills, and the third assessment report (TAR) stated that ‘It is concluded that statistical downscaling techniques are a viable complement to process-based dynamical modelling in many cases, and will remain so in the future.’ This is re-phrased in AR4 as ‘The conclusions of the TAR that [E]SD methods and RCMs are comparable for simulating current climate still holds’.
So why were there so few references to ESD work in AR4?
I think that one reason is that ESD often may unjustifiably be seen as inferior to RCMs. What is often forgotten is that the same warnings also go for the parameterisation schemes embedded in the GCMs and RCMs, as they too are statistical models with the same theoretical weaknesses as the ESD models. AR4 does, however, acknowledge this: ‘The main draw backs of dynamical models are … and that in future climates the parameterization schemes they use to represent sub-grid scale processes may be operating outside the range for which they were designed’. However, we may be on a slippery slope with parameterisation in RCMs and GCMs, as the errors feed back to the calculations for the whole system.
Moreover, a common statement heard even among people who do ESD, is that the dynamical downscaling is ‘dynamical consistent’ (should not be confused with ‘coherent’). I question this statement, as there are issues of gravity wave drag schemes and filtering of undesirable wave modes, parameterisation schemes (often not the same in the GCM and the RCM), discretisation of continuous functions, and the conservation associated with time stepping, or lateral and lower boundaries (many RCMs ignore air-sea coupling).
RCMs do for sure have some biases,yet they are also very useful (similar models are used for weather forecasting). The point is that there are uncertainty associated with dynamical downscaling as well as ESD. Therefore it’s so useful to have two completely independent approaches for studying regional and local climate aspects, such as ESD and RCMs. One should not lock onto only one if there are several good approaches. The two approaches should be viewed as two complementary and independent tools for research, and both ought to be used in order to get a better understanding of the uncertainties associated with the regionalisation and more firm estimates on the projected changes.
Thus, the advantage of using different methods has unfortunately not been taken advantage of in chapter 11 of AR4 WGI to the full extent, which would have made the results even stronger. When this points was brought up during the review, the response from the authors of the chapter was:
This subsection focuses on projections of climate change, not on methodologies to derive the projections. ESD results are takan into account in our assessment but most of the available studies are too site- or area-specific for a discussion within the limited space that is available.
So perhaps there should be more coordinated ESD efforts for the future?
On a different note, the fact that the comments and the response are available on-line demonstrates that IPCC process is transparent indeed, showing that, on the whole, the authors have done a very decent job. The IPCC AR4 is the state-of-the-art consensus on climate change. One thing which could improve the process could also be to initiate more real-time dialog and discussion between the reviewers and the authors, in additional to the adopted one-way approach comment feed.
Uncertainties
One section in IPCC AR4 chapter 11 is devoted to a discussion on uncertainties, ranging from how to estimate the probability distributions to the introduction of additional uncertainties through downscaling. For instance, different sets of solutions are obtained for the temperature change statistics, depending on the approach chosen. The AR4 seems to convey the message that approaches based on the performance in reproducing past trends may introduce further uncertainties associated with (a) models not able to reproduce the historical (linear) evolution, and (b) the relationship between the observed and predicted trend rates may change in the future.
Sometimes the uncertainty has been dealt with by weighting different models according to their biases and convergence to the projected ensemble mean. The latter seems to focus more on the ‘mainstream’ runs.
AR4 stresses that multi-model ensembles only explore a limited range of the uncertainty. This is an important reminder for those interpreting the results. Furthermore, it is acknowledged that trends in large-area and grid-box projections are often very different from local trends within the area.
RE: Asia
Are there any plans to do GCM and/or regional model runs that will include the findings of Ramanathan et al (RE: aerosols)?
Ramanathan et al, Nature 448, 575-578 (2 August 2007) doi:10.1038/nature06019
I am wondering whether these regional models can explain the large difference in sea ice anomolies between the north and south poles.
The north pole is showing what you’d expect from the temperature rise, with an alarming decrease in ice coverage, but the south pole seems to be unaffected.
Thanks for the excellent info.
I wish there a more explicit analysis in AR4 of the regional climate change in the Mediterannean region. As a resident of Greece, and a volunteer fire-fighter, I have the impression that we are dealing with a number of novel phenomena. The wildfires are spreading at an unprecedented speed, for example. They cross highways, and even residential areas, without any problem. The interactions between ecosystems, land-use change, regional climate change, forest fires and microclimate are very odd too; for example, we observed today that even without any wind the fire creates enough turbulence to prevent the helicopters and the waterbombers from acting effectively.
I was intrigued by the comments on Glomfjord precipitation. Does anyone have a link to the more recent Nordklim data?
[Response: http://www.smhi.se/hfa_coord/nordklim/ -rasmus]
It seems that projecting ahead one century is so difficult and uncertain that projecting ahead more than one century is just too difficult to attempt right now. Is this true? I understand that there is an error buildup problem and an unforseeable consequences problem.
Thanks for the link but this only gives the data to 2002. Is there nothing more uptodate?
Woops! I also see that some models may be “operating outside the range for which they were designed.” And there are always the computing and manpower problems. No wonder the projections don’t go beyond 2099.
I’d answer Edward Greisch’s question (below) just by saying that, the further out you want to project, the larger the range of scenarios you must state. For example, issues such as the national number of homes retrofitted for reduced consumption is far from clear. So that variable alone would require a range of scenarios, maybe ranging from zero to 100%.
# Edward Greisch Says:
28 August 2007 at 8:41 AM
It seems that projecting ahead one century is so difficult and uncertain that projecting ahead more than one century is just too difficult to attempt right now. Is this true? I understand that there is an error buildup problem and an unforseeable consequences problem.
Re #2:
Antarctic amplification only occurs when models are run long enough so that heat uptake in the Southern Ocean does not damp the positive feedbacks and if stratospheric ozone do not cause compensatory cooling. Ozone is a significant greenhouse gas in the polar regions.
There are also large differances between NH and SH land masses that can support seasonal snow. Another possible factor as is the existance of large ice shelves in the SH that are still capable of calving enormous amount of ice into the sea. In contrast, ice shelves in the NH are for the most part history.
I think it’s good to keep in mind that these projections are mainly climatic projections (temps, precip, wind, etc), and there will likely be lots of other global warming impacts for each region — disease spread, crop failure, & some crop enhancement in a few areas, forest/brush fires, species extinctions & how that might affect ecosystems, etc.
Just read about the bee collapse again today. They’re narrowing it down to some disease or organism, but some think that might be a result of lowered immunity. I’m not saying global warming is playing a role (tho it might, & they have to look at all things going on), but if it were, that would be an example of how effects can reverberate and cause harms in areas no one is thinking about today.
And then there are all sorts of other harms from the very actions that produce AGW — e.g., the other pollution from driving cars or using synthetic fertilizers, etc.
We have to thank the scientist for their very hard work in getting to today’s level of knowledge. And keep in mind there are many other things that could happen, which prudence and holistic thinking (as opposed to analytic/piece-meal thinking) requires us to keep in mind.
One burning question on the Polar Regions
Ice sheets are a dynamic system. What happens when you add weight (in the form of snow) to the top of the ice depends on the temperature. If the bottom of the ice is very cold then the ice is strong, and it will support a lot of weight. If there is (melted fresh) water at the bottom the ice, then that ice is near its melting point, and relatively weak. If you pile more weight on ice that is near its melting point – it will flow more rapidly.
Piling more snow on top of Antarctica will not increase the amount of ice there, unless the base of the ice sheet stays cold. Some of those ice sheets are standing in seawater. If that seawater is getting warmer, than the ice at the base of the ice sheet will get weaker and the ice sheet will get thinner – regardless of how much snow falls on it.
I am not saying that this is the answer. I am saying that the amount of snow falling in Antarctica or Greenland is not the complete answer to sea level issues.
My apologies for this aside, but I would appreciate it one of you experts could answer a question for me. An acquaintance of mine is a skeptic and a metrologist. As you probably know, metrologists are in the business of calibrating instruments.
He argues that the recorded temperature changes indicating global warming , which are generally in the .1 C degree range, are meaningless, because the best terrestrial recording devices we have can only record temperatures with a +/- accurace of .5 C degree.
Assuming that’s true (maybe a big assumption!), would it be the case that this is overcoming by averaging the results of many stations? Or …?
I’d be grateful if someone could address this in layman’s terms.
[Response: When you take the average of many independent measurements, the errors will tend to cancel. So, for a single series, yes it’s true that it would be silly to state the figure to 0.1C precision if the errors are +-0.5C, but when taking the mean over thousands of series, then 0.1C signals are discernible. -rasmus]
“Therefore, I was surprised to see such an extensive representation of the PRUDENCE project in this chapter”
Given the fact that the lead author of the chapter 11 of AR4 is also the co-ordinator of the PRUDENCE project, it is not very surprising… ;-)
Very good point Aaron (post 11) about more weight on a weaker ice base. That didn’t come to mind when reading this.
Although I must admit reading this blog entry is quite fustrating considering how much “uncertainities” there are in these GCM’s. I understand the planet is huge even though compared to the bigger picture it’s tiny, but it boggles my mind at times that we don’t have a better “geographical map” of the planet, or maybe I’m confused. When taking Geology last semester, the teacher never really indicated that the planet was so “unmapped” except when it came to the Ocean’s which I know NOAA and other intrests associated with them are working on mapping the sea floor. I for one, would think it would be better to work on incorporating better geographical data into these climate models before attempting to predict future climates under AGW. IMO, making such predictions with 50 uncertainities doesn’t offer much in the world of “reliability”.
Hopefully one of the primary goals of the IPCC is to improve the models so that influences from local geography are better incorporated into the GCM’s. After reading this blog it seems like a very uncertain analysis, maybe one which should have been omitted untill the GCM’s had a better corelation with the geography. That’s what I got from this.
Thanks for the nice review
GavinRasmus.[Response: watch for the author name…. – gavin]
Warm winter predicted for North America:
http://www.cpc.ncep.noaa.gov/products/predictions/multi_season/13_seasonal_outlooks/color/churchill.html
Alex #2,
The Antarctic Peninsular is warming (about 5 times the rate of global
warming at present IIRC). But as you say most of Antarctica is not. Here’s
a few reasons, not in order of importance.
1) The Antarctic has a lot of ice well above sea level, as you get higher
it gets colder.
2) Sitting on water the Arctic gets a double hit – warming from the
sea and from the air. Where the ice is broken up or melts, warmth from
the ocean can cause local atmospheric warming even if the air mass above
is cold.
3) Both poles have air systems that are basically vortices spinning around
the pole. In the North there are land masses bordering the Arctic Ocean, as
the vortex swirls over this uneven surface it’s disturbed (Rossby waves)
and allows warmer air to get into the polar region. In the South (Antartica)
there’s ocean around the continent, which is often hellishly rough but does
not cause as much disturbance to the vortex.
Antarctic Oscillation: http://www.jisao.washington.edu/aao/slp/
Arctic Oscillation: http://jisao.washington.edu/ao/
4) In the southern hemisphere (SH) there’s a lot of ocean, and that damps the
warming trend in the SH. Water has a high specific heat capacity, and unlike
land it can circulate heat to lower levels. It also loses heat to evaporation.
Evaporation also happens on land(where there’s water – and there’s no shortage
of water in the ocean) but the land doesn’t circulate heat away from the
atmosphere as water can. So the warming trend is more marked in the northern
hemisphere.
5) Storms can break up ice that sits on water, but they don’t have as dramatic
an effect on land based ice.
Current models that incorporate ocean dynamics do show the basic difference
between Antarctic and Arctic, the latter is melting significantly while the
former isn’t.
#11 Aaron,
I don’t think even a century of precipitation as snow will substantially
affect melt by virtue of it’s weight. There’s hundreds of thousands of
years of ice accumulated on Antarctica, in some regions over 600k years,
e.g. Lake Vostok.
More important for Greenland seems to be surface melt extent and it’s
impact on glacier flow. The water percolates down through fisures in
the ice (called “moulins”) and lubricates the boundary between the ice
and the rock on which the glacier sits.
e.g. http://earthobservatory.nasa.gov/Newsroom/NasaNews/2002/200206069411.html
Don’t expect the bulk of Antarctica to melt any time soon, Greenland is
however more interesting in that respect, although by “soon” in that context I
mean “anytime this century”.
Regards
Cobbly(non-professional climate science hobbyist)
Thanks for the post Rasmus,
I understand the percieved need for science to provide guidance on the impacts
of Global Warming. However on this issue I’m not so sure that the regional detail
is more help than hindrance.
The year in the UK has been odd, we’ve had an early “summer” of sorts in Spring,
mainly April, and the Summer has on the whole been more like a traditional autumn.
I understand that this is probably due to the recent El Nino (EN) and it’s
impact on the Jet Stream, hence storm tracks.
If we can’t be sure of the response of largescale systems like the EN to global
warming then how can we know what regional effects will be? This summer, when
considered with the possibility of a persistent EN, could feasibly become more
of a normal event. That would blow a hole in projections of a likelihood (so
far observed for the UK) of reduced summer precipitation.
As far as I can see we can be sure of the warming and our causative role in it. We
can be pretty sure that it’ll not be a positive process to go through (mainly due to
the number of people and the complexity of our societies). There are general things
that can be stated – such as likelihood of heavier precipitation (when it rains) in
a warmer climate. But as far as regional effects for many areas, it seems to me that
we can say little more than “Carry on as we are and we’ll find out”.
What happens if we start adapting to a modelled regional outcome and reality goes
the other way? Regional skill is crucial, but at this stage I think it’s crucial for
improving the models further. Not for public presentation.
I’ve noticed that despite floods, hydro power is considered less reliable at sites on every continent. That could of course be due to running down dam levels to meet demand peaks or to general demand growth. The shortfall in electrical generation is usually made up by coal. The double whammy will be natural water shortages and administrative carbon constraints at the same time.
Hi Rasmus/all
Thanks for the overview and talking points on regional effects and predictability based on current understandings.
While the models are getting better I am assuming that climate zone shift will be a problem environmentally and economically and increasing as things progress requiring new solutions along the way for society.
I am also assuming there will be larger climate momentums due to more weather energy agitated by more heat and moisture, and climate associated inputs. So on my web site I have a general consideration of more floods, droughts, heat waves, cold snaps as the earth continues to warm due to continued GHG accumulation in the atmosphere.
I guess my question is, is this a fair assumption? Is there an easy way to put it in context to help people understand this in simple terms?
Slightly off topic, but not sure where else to ask this: according to various definitions “albedo” is simply the ratio of reflected to incident radiation. Is it therefore correct to say that increasing the greenhouse effect is reducing the Earth’s albedo? I’m not talking “surface albedo”, anthropogenic changes in which are also affecting the climate, but the albedo of the whole planet, if such a thing is meaningful. If so, is there publically available data for satellite measurements of “planetary” albedo?
RE 16
I was referring to plastic flow of nominally solid ice near its melting point.
With the discovery of lakes of water under Antarctic ice, we can no longer assume that all Antarctic ice is very cold and very strong.
Re my previous post, I think I found an answer to the first question: “albedo” only applies to radiation at visible wavelengths, whereas the greenhouse effect is affecting radiation at infrared wavelengths. However, I’m still looking for data that shows the trend in the Earth’s overall energy budget over the last few decades, as per satellite measurements.
I’ve found http://eosweb.larc.nasa.gov/HPDOCS/projects/rad_budg.html, but I was hoping for something a bit more user-friendly.
My apologies Rasmus! I’m “fairly” new to this blog, as I’ve begun to read it more frequently in the past few months. It didn’t even occur to me that different scientists were blogging here! I know, Shame on me. I just read the text and assume it’s Gavin.
Well, Thank you Rasmus for the nice review. I’d rather restate it then have a “edited” thank you here.
Thanks for a very interesting post. I too have complained about the difficulty in getting good regional projections vis-a-vis my focus region, Latin America and the Caribbean (LAC). Given your interest in the subject, you might wish to check some of my posts on the issue:
The Probable Impact of Climate Change on Chile
Impact of Sea Level Rise on LAC
Probable Impact of Climate Change on Brazil
I would be interested in your take on them. If you spot more studies relevant to the region in your search, any chance you can let me know? Or maybe do a guest post on The Temas Blog? Climate change is not my only focus, but it has been one of the more popular topics on the blog.
It would be interesting to know more about the physical mechanisms involved in the regional effects of climate change.
(For example, my questions / speculations in comments 171 – 173 and 175 at https://www.realclimate.org/index.php/archives/2007/08/the-co2-problem-in-6-easy-steps/ (since those comments I’ve found a few papers on some of those points, for example –
“On Baroclinic Instability as a Function of the Vertical Profile of the Zonal Wind”
http://docs.lib.noaa.gov/rescue/mwr/095/mwr-095-11-0733.pdf
– though I’d still like to know more) (also, if extratropical storm systems were larger in size horizontally (which would make sense with a higher tropopause, but setting aside other factors), then a smaller number of storms at a given time would cover the same area…))
I suppose I’ll find more in the IPCC report of course, but how much more I don’t know, so I wanted to bring the matter up here.
Re 22 (Dylan) – actually, the sun does emit significant IR (and some UV) – albedo encompasses all solar radiation (SW (short-wave) radiation), but solar IR is mostly in shorter IR wavelengths, whereas the IR emitted by the Earth and atmosphere is mostly longer wavelengths (it is LW (long-wave) radiation). There is some overlap, but an approximate cutoff between the two is around 4 microns. Rather than differentiating just between visible and IR, it is often handier to differentiate between SW and LW.
Oh yeah same old thing over denierville. Murdoch taking over will be a big change. Yawn. Mann Won’t Disclose Algorithm. It’s odd, the deniers are the ultimate authority and the experts misguided. Well isn’t that the way with amateur opinions? Up is down baby!
Re #14: [I for one, would think it would be better to work on incorporating better geographical data into these climate models…]
I think you’re misunderstanding the reason for the lack of geographic resolution in the models. It’s not that the information isn’t readily available, it’s a question of the grid cell size that the model uses. Say you use a 100 km grid with 20 vertical levels, that gives you about a million (if my mental arithmetic is right) grid cells. Each of these needs to maintain a bunch of state variables, and have various complex calculations done on them, which takes computer time and memory. (Gavin or others could give you a better idea of how much is needed per cell.)
Any geographic feature smaller than the grid size is going to be smoothed out, obviously. But if you cut the horizontal grid size in half, you multiply the resources needed by 4. Pretty soon you get to a point where you don’t have enough compute power to run the model in reasonable time.
[[Slightly off topic, but not sure where else to ask this: according to various definitions “albedo” is simply the ratio of reflected to incident radiation. Is it therefore correct to say that increasing the greenhouse effect is reducing the Earth’s albedo? I’m not talking “surface albedo”, anthropogenic changes in which are also affecting the climate, but the albedo of the whole planet, if such a thing is meaningful. If so, is there publically available data for satellite measurements of “planetary” albedo?]]
Earth’s bolometric Bond albedo (the one used in temperature work) has been measured by Earth-orbiting satellites since at least 1966. Global warming shouldn’t have a very large effect on the albedo, although there might be some effect from melting of ice. Most of the Earth’s albedo (0.306 according to NASA) comes from clouds rather than the surface, because clouds cover a lot of area (62% of the globe according to one recent estimate) and are fairly bright.
#21 Aaron,
As I say I’m no expert, so I’m happy to be corrected, but here I go:
I did understand you meant ice near 0degC, but my point is in Antarctica the
bulk of the ice sheet’s surface is well below 0 degC year round.
The discovery of the Antarctic sub-glacial lakes (well over 100 found so far
and evidence of inter-connection) does not necessarily call into question ice
sheet integrity. They seem to exist mainly due to geothermal activity, which is
not subject to an increasing trend as a result of CO2 emissions (unlike the surface)
Given that EPICA have ice core data going back over 750k years, and that these
lakes could well be a permanent feature existing over that period, I don’t see
them as a cause for immediate concern. Once the bulk of Antarctica warms enough
for substantial ice loss, or if the peripheral glaciers retreat and aren’t there
to butress glaciers higher up, then the lakes may become a factor. But if you’re
looking for a rapid response to climate change over this century, Greenland looks
like a better bet. That said, the West Antarctic ice sheet may also produce
surprises.
I’ll leave it there as this is off topic.
Nice to see a general idea of what regional variation is currently predicted, and no doubt we can expect some of the uncertainty to be resolved in the next couple of years.
PS couple of errors I noticed in the article: ‘singal-to-noise’ and ‘topical cyclones’ that might want to be fixed.
[Response: Thanks! Fixed now!. -rasmus]
From the lack of responses to my #4 and #6, I assume that nobody has more recent Nordklim data than 2002? Doesn’t the absence of data make validating the models a bit difficult?
[Response: No, I don’t have an updated version of the Nordklimadata, but the data are from the Norwegian Climate Archives, which is openly accessible from the met.no servide eKlima (currently, the page is in norwegian, but an English version is in progress). Thus the shown data are updated observations for Glomfjord from the Norwegian climate archive.
-rasmus
A couple of months ago, there began a series of posts in the CS group with regard to Dr. Hansen. Similar discussions have been going on since then, with a general tone that Dr. Hansen has left science behind and has become an advocate, possibly influenced by a deep religious belief that we have a moral obligation to save the planet.
I would rather stick to scrutiny of the science itself. In that vein, William Kininmonth replied to a question of mine with the following post. I ask for comment from others on this board to assist me in understanding Kininmonth’s general point, which seems to be that the warmer it gets, the more evaporation there will be, which will transfer heat energy away from the surface and thus keep surface temperatures from escalating to the extent that Dr. Hansen projects.
Here is Kininmonth’s post in its entirety. I welcome all responses, and thank you in advance.
==========
The blanket metaphor is quite inappropriate. A blanket slows the rate of conduction and stores heat in the medium but radiation flows at the speed of light. It is the processes that regulate energy flow that are important.
[Response: When the atmosphere gets opaque, then the heat transfer start to resemble a diffusion process, as the photons get shorter free mean path. An example of the extreme is the the Sun with the outer convective zone is opaque and the outward energy transport is mostely due to convection – despite the individual photons with speeds of light. -rasmus]
In addition, it is not retention of heat that is of concern because the heat content of the atmosphere is miniscule – equivalent to the top 30 cm of the ocean surface. It is often said that the oceans are the thermal and inertial flywheels of the climate system.
The temperatures of the earth’s surface and the atmosphere are regulated by the energy flows, not by the actual retained heat. There is more heat in the mixed surface layer of the tropical oceans than in the surface layer of the hotter tropical deserts because of evaporative cooling. The temperature lapse rate of the tropical atmosphere is maintained by the need for convective overturning, not by radiation processes.
[Response: The temperature is what is actually measured – the empirical data show an increase – and it is a measure of retained heat. The temperature for the oceans also sho a warming (see the IPCC AR4). Yes, the temperatures are affected by the radiative energy balance, as well as latent and sensible heat (convection). But the temperature is also related to the heat according to the first law of thermodynamics. Furthermore, the Stefan-Boltzmann law, diffusion, and evaporation affects the energy flows, so the temperature and the energy flow are closely coupled. But, I’m not sure I understand which points William Kininmonth wants to make with this statement. -rasmus]
If you really want to understand what is going on then I urge you to read the Riehl and Malkus paper I referenced in my previous posting. In 1958 they accepted without argument (because of theory and supporting observations) that radiation processes associated with greenhouse gases and clouds cool the atmosphere. Their challenge was to explain how the heat accumulating at the surface from solar radiation was distributed through the troposphere to offset the radiation cooling of the troposphere.
The final point relates to the temperature of the earth’s surface. Solar insolation absorbed by the surface is offset by net IR emission, conduction and evaporation from the surface. Increasing the back radiation through increased CO2 concentration will reduce the net emission from the surface and this must be offset by increased IR emission, increased evaporation and increased conduction. The rates of increase of IR emission and latent energy exchange (evaporation) are relatively large and provide a powerful brake against surface temperature rise. Tropical oceans are cooler than deserts at the same latitude because of evaporation.
[Response: The whole point is that the IR-emission is reducted – not increased. Increased optical depth (more opaque) means that the IR escaping from the planet originates at higher levels with lower temperatures. And that the heat is redistributed within the system. -rasmus]
Some ball-park numbers. The increase in back radiation from a doubling of CO2 is 3-4 W/m2. At 15C the rate of increase of blackbody IR emission is 5 W/m2/C. The rate of increase in latent heat exchange is 5-6 W/m2/C. Direct increase in back radiation by doubling CO2 will be offset by increased IR emission and latent energy exchange if the surface temperature rises by less than 0.4C.
[Response: Any change in latent heat exchange will probably involve a change in the hydrological cycle, and is related to the most serious aspects of a climate change: floods and droughts. Thus excessive rainfall may be more problematic than high temperatures, at least in some parts of the world. -rasmus]
The earth’s surface is 70 percent ocean and evaporation provides a powerful brake on further temperature rise.
William Kininmonth
re #33
Similar discussions have been going on since then, with a general tone that Dr. Hansen has left science behind and has become an advocate, possibly influenced by a deep religious belief that we have a moral obligation to save the planet.
=====================
How about just a healthy sense of self-preservation?
Though I do believe, as do many, we have a moral obligation to our descendants, specifically our children and grandchildren, not to thoroughly muck up the world they’ll live in through our own greedy and short-sighted lifestyles. One does not need to be a scientist or a priest to comprehend this, and if Dr. Hanson does feel any moral obligation to the future, it is my SUPREME doubt this is affecting the manner in which he conducts himself as a scientist.
If anything, instead of people attempting this rather obvious ad hominem attack on his motivations you report, perhaps they should be instead wondering why scientists, specifically climatologists but also professionals from many fields are becoming increasing vocal in their warnings regarding what we are facing.
Walt,
I’m not sure I understand Kininmonth’s point. Yes, water evaporation will increase, but 1)water vapor is itself a greenhouse gas, and 2)evaporation alone does nothing to significantly affect the energy balance of climate. That is, the only way we get rid of energy is still via LW radiation. Is it Kininmonth’s contention that evaporation will lift the energy above where the CO2 greenhouse effect is significant, allowing it to escape to space? This does not seem credible.
Second, I strongly object to the use of “religious” to describe the impulse to save the planet. While religion may indeed be a motivation for a sentiment, I might argue that common sense is sufficient cause to preserve the only planet capable of supporting human life. The research Hansen has done has serious implications for public welfare. Given that most people do not understand that scientific studies are by their nature conservative, it is not inappropriate that Hansen explore the range of the possible outcomes as well as the probable. I would note that in addition to these outreach activities, Hansen et al. have continued to produce good science, so I would suggest your swipe is ad hominem and unfounded.
Finally, might I point out that there are some for whom the word religious is not necessarily a pejorative and may object to your equation that religious = irrational.
William, the only thing evaporating from Earth in any significant amount is a bit of hydrogen and helium gas from the top of the atmosphere. Evaporation and condensation of water in the lower atmosphere isn’t doing anything but rearranging the heat coming in from the sun. I think he’s confused because he’s not taking into account the slow process of heating the oceans, which has a lag time of centuries.
Ray, I believe Walt was reporting the ad hom, not making it himself.
Re 30
Off Topic? I cite Hansen 2007 as evidence that Sea – Ice interactions and ice dynamics are relevant to climate modeling and regional climate impacts. While sea level changes may not dramatically affect regional temperatures or precipitation; sea level changes will affect human infrastructure – and that is very much – a regional climate effect that SHOULD BE predictable from climate models.
Infrastructure planning and budget have very long timelines. Planners need as much warning as they can get. They need to know what scientists are 98% certain of, and what we think has a 2% chance of happening. Flood planners routinely engineer and plan for storms and conditions that they expect to occur only once in 200 years. People die if the engineering is wrong.
Pretend that you have the chief engineers for the transportation systems of the 5 largest cities in the world. Their mandate is to be 98% certain that their systems can withstand an event that would be expected only once in 200 years. What kind of storm surges do you tell them that they should expect once in the next 200 years? People’s lives and treasure are at stake. What do you tell them? What do you tell them so that they can have 100% confidence that their design standards have a reasonable and rational basis?
Hansen is very correct. This is no time for reticence.
re: #33 Walt
Given that Kininmonth says firmly that:
“Greenhouse gases emit more radiation than they absorb and their direct impact is to cool the atmosphere. More greenhouse gases will not cause the atmosphere to warm…”, what level of credibility do you ascribe to the rest of his opinions?
http://www.theage.com.au/news/letters/telling-insight-into-immigrations-mindset/2005/10/09/1128796408597.html
While sea level changes may not dramatically affect regional temperatures or precipitation; sea level changes will affect human infrastructure – and that is very much – a regional climate effect that SHOULD BE predictable from climate models.
Modeling global and regional warming is really risk assessment. We just do not have very good data.
Infrastructure planning and budget have long timelines. Planners need as much warning as they can get. They need to know what scientists are 98% certain of, and what we think has a 2% chance of happening. Flood planners routinely engineer and plan for storms and conditions that they expect to occur only once in 200 years. People die if the engineering is wrong. Climate models will have to be the basis for that engineering.
Pretend that you have the chief engineers for the transportation systems of the 5 largest cities in the world. Their mandate is to be 98% certain that their systems can withstand an event that would be expected only once in 200 years. What kind of storm surges do you tell them that they should expect once in the next 200 years? People’s lives and treasure are at stake. What do you tell them so that they can have 100% confidence that their design standards have a reasonable and rational basis?
In the early days of human health risk assessment from hazardous waste sites, we did not have very good data either. Therefore, we made our best guess, and added a safety factor (usually 10 or 100) depending on the quality of the guess. The nature of the calculation resulted in all those safety factors being multiplied together, so the overall safety factor was often a thousand or even a hundred thousand. (See US EPA Guidance on Human Health Risk Assessment)
Now, take everything that you know about sea level change and where there is poor data or a poorly understood process put in a safety factor of 10 or 100. Multiply all the safety factors together. Now estimate sea level change and multiply it by the combined safety factor. OUCH!! Something like THAT should be sea level change for engineering and public policy planning.
Hansen is very correct. This is no time for reticence.
#36, Hank R,
Water evaporating at the surface converts sensible heat to latent heat that is convectively transferred to higher regions of the troposphere. When the water vapor condenses the latent heat is converted back into sensible heat, now high in the atmosphere rather than at the surface. The argument is that this high altitude heat can radiatively escape more efficiently than that at the surface. I’m not promoting or rejecting this argument.
Perhaps you can explain something for me. This notion for the long lag times for heating the oceans escapes me. When the oceans absorb short wave radiation from the sun and internally converts (very short time scale, no more that milliseconds) it to sensible heat, then the heat is there in the ocean. It does go somewhere, undetectable, and the reappear a century later. What is meant, physically, by this lag time?
Thanks
Re #41: [What is meant, physically, by this lag time?]
You might start with the concept of specific heat. Or do a simple experiment: Turn on your stove, let the burner get hot, then put a pot of water on it. The heat from the burner goes into the water immediately, just as solar heat goes into the ocean, but it still takes a long time to warm up. Now imagine the pot’s a couple of thousand feet deep, and you’re just heating the surface :-)
Re # 14 Chris S: “…it would be better to work on incorporating better geographical data into these climate models before attempting to predict future climates under AGW.”
Without addressing the issue of how important the missing geographical data really are, I would ask: How do you know when you have sufficient geographical data? What criteria would you use?
[In science, you never (or rarely) have all the data you might want – if you held off drawing any conclusions until “all” data are in, you will never draw any conclusions, never publish any papers, never make any progress. The best you can do is go with what you have, and recognize that over time your understanding will (usually) improve. Scientific knowledege is a work in progress.]
#42 James,
I get it, but I thought #36 Hank was referring to something less blindingly obvious than the future short wave energy input to heat the oceans in the future. As it stands, then, Hank’s reference to the ocean lag time is completely irrelevant to Kininmonth’s argument (in post #33). Thanks.
Shoes,
I think the lag is just due to the thermal mass of the oceans. Sunlight only gets down to the first 30-100 meters or so. All the rest of the heat has to come from mixing warm surface waters with the huge thermal mass below–a very slow process if it occurs at all. Even the top 100 meters will warm very slowly.
I think having any faith in GCMs to come anywhere near relatively small regional projections (rainfall, temperature, prevailing winds, cloudiness in outer Mongolia in 2075, e.g.) is just mind boggling and beyond the pale. The piddling caveats and uncertainty expressed are presented insignificantly. OTOH, I do not have any problem with IPCC or GCMs offering speculations based on the loose and tentative scientific projections in this area — in fact I think they should — but the caveats and speculative nature ought to be described very clearly and prominately. Otherwise it feeds us skeptics paranoia that GCMs are just making things up!
#15) Hank:
I have been observing the CPC model output for a number of years. However, I would start questioning how good the models are going to perform with the changes that are taking place in the Arctic since they are statistical models. (Yes, I think this winter will be late to start and will most likely be quite mild). With the ice cover less than 3 million sq km as of today and still dropping, I think the statistical models are going to become less reliable since they use past history. The same thing is true of the statistical models used by the NHC and Dr. Gray. I have a lot more faith in the dynamic mode from the UK Met office for hurricane forecasting.
I think it would be great to have a discussion on this site of statistical models vs dynamic models.
Re: #29 – but isn’t the whole point of global warming that the ever increasing greenhouse effect is causing the Earth’s total radiation budget to change with time? And how is the total radiation budget difference to “bond albedo”?
I’ve got a little further trying to get hold of time-series data of satellite measurements of outgoing radiation, but it’s in a horribly arcane format that I don’t really have the time to process into a simple graph showing that the total amount of outgoing radiation has been decreasing since the measurements began (in the 80’s as it turns out).
Rod, what does the PCMDI site lack? (link in top post; site’s down for power supply upgrade at the moment but will be back soon, per the Google Cache version of their page)
Re: #41,
“The argument is that this high altitude heat can radiatively escape more efficiently than that at the surface. I’m not promoting or rejecting this argument.”
I think that is part of the point, as well as that the surface will in fact be cooled by the evaporation. Kininmonth proposes that increasing greenhouse gases have the effect of cooling the surface.
Re: #39,
“what level of credibility do you ascribe to the rest of his opinions?”
It’s not his opinions I am seeking to understand; it is his analysis. Kininmonth is proposing that Hansen has missed something. I am hoping for some serious discourse on this. Consider this one of my occasional attempts to get each side to discuss the same point in the same way, so that a layman has half a chance to make sense of it.